Messy sales dataset cleanup
Profile duplicates, nulls, invalid dates, inconsistent categories, and outliers; publish a documented cleaned dataset and validation summary.
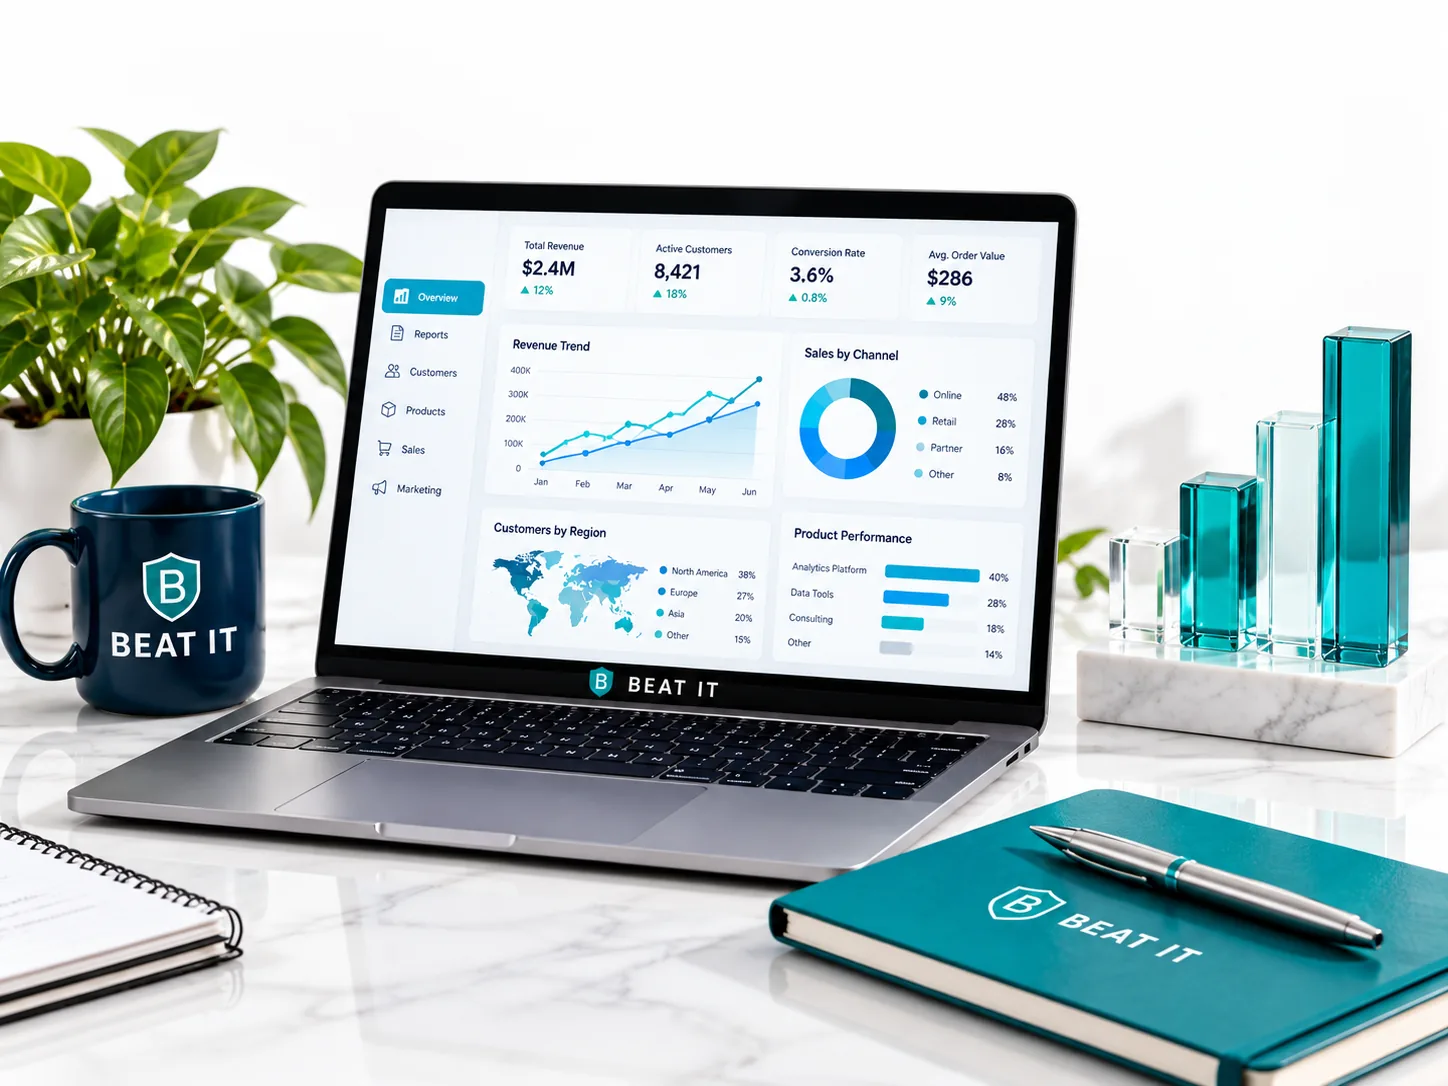
Turn business data into decisions that matter.
Video · Reading · AI Tutor · Resources · Labs · Real Job PracticePlease wait while we check your signed-in account.
Analyst fieldwork
Profile duplicates, nulls, invalid dates, inconsistent categories, and outliers; publish a documented cleaned dataset and validation summary.
Use joins, CTEs, aggregates, and window functions to explain a revenue change and reconcile totals to an authoritative source.
Build a reviewable workbook with tables, XLOOKUP, validation, PivotTables, charts, assumptions, and reconciliation checks.
Create a star-schema model, DAX KPIs, accessible visuals, drill paths, and a concise executive narrative.
Investigate operational events with search, fields, time windows, aggregation, anomaly evidence, and a stakeholder-ready finding.
Define quality rules, identify failures, quantify business impact, assign owners, and document remediation and monitoring.
Reconcile the metric definition, segment the change, isolate the main drivers, validate against source data, and deliver an evidence-backed explanation.
Trace source, joins, filters, date logic, refresh state, and measure definitions; document root cause and a reproducible fix.
Profile the model/query, correct the calculation, validate performance and totals, and document the optimized design.
Use Splunk or event data to establish baseline, time window, affected entities, correlated events, and a concise finding with limitations.
Implement least-privilege access and row-level security, test positive and negative cases, and document ownership and review.
Portfolio capstone
Take a fictional company from raw relational, spreadsheet, and event data through discovery, cleaning, SQL analysis, semantic modeling, dashboard delivery, operational investigation, governance, and executive presentation.
Locate databases, schemas, files, reports, semantic models, workspaces and owners
Request only required access and read the data dictionary and KPI definitions
Inspect refresh schedules, failed jobs, existing dashboards and known data-quality issues
Reproduce one trusted report total before changing anything
Complete a scoped SQL or reporting ticket with validation evidence
Trace one KPI from dashboard back to source columns and business definition
Clean and reconcile one imperfect dataset
Present a finding to a stakeholder and record assumptions and open questions
Own a small analytics delivery from requirement through governed publication
Build or improve a dashboard with tested KPIs and documented lineage
Complete an operational investigation using event/search data
Present business recommendations, limitations and next actions to technical and executive audiences
Interactive analyst lab center
Use the Northstar workplace data to complete four increasingly independent analyst assignments. Completion is stored on this device while the server-backed portfolio tracker is developed.
0 of 4 core workplace labs marked complete.
SQL · Guided
Ticket: The VP of Sales says revenue appears lower. Determine whether the change is real and identify the main drivers without inflating totals through joins.
Business question: What changed in completed-order revenue by month and region, and which data-quality issues can change the answer?
SQL investigation with queries, validation checks, findings, assumptions, and a one-paragraph executive summary.
Excel · Assisted
Ticket: Finance says the dashboard target variance does not match its monthly worksheet. Reconcile actual revenue to the approved regional target file.
Business question: Which month/region combinations are above or below target, and are mismatches caused by data or business logic?
Excel reconciliation workbook with source tabs, controlled calculations, QA checks, PivotTable, and management summary.
Power BI · Independent
Ticket: Leadership wants one governed view of revenue, target attainment, order trend, and regional performance with clear definitions and drill-down.
Business question: How should Northstar performance be modeled and presented so executives can answer what happened, where, and what needs attention?
Power BI dashboard package: transformation notes, model diagram, DAX KPI catalog, validation evidence, dashboard screenshots, and executive narrative.
Splunk · Workplace Challenge
Ticket: Operations reports intermittent order failures and slow response times. Identify when the incident started, affected services/regions, likely pattern, and business impact.
Business question: What changed in service errors and latency, and what evidence supports escalation or remediation?
Splunk investigation report with searches, timeline, evidence table, dashboard concept, limitations, and recommended next action.
 BEAT IT TRAINING & STAFFING
Practice real analyst tasks, from discovery to dashboards and handoff.
Loading course details…